Multi-Tracking K-Means | Motion Tracking
Team Lead (Lead Programmer)
This algorithm was developed on the Microsoft® Kinect for Creatabase, an Art Installation project I lead for Bradley University's Interactive Media exhibition known as FUSE. The project was finished and on display on April 27th, 2018 at the Riverfront Museum in Peoria, IL. Over 300 users participated and even more got to try out the exhibit!
This art installation project was essentially an interactive art gallery where visitors (primarily children) can draw/create pieces of art and have them "digitized" (taken a picture of and uploaded) to a database. This database is then read from and every piece of art in it is rendered on a big projected screen where users can sift through them using their entire bodies. Users movement and distance from the screen will decide whether the art blows around like paper in the wind or comes forward to be expanded and viewed. For this kind of full body interactivity to be a success, an algorithm had to be implemented in order to track multiple users.
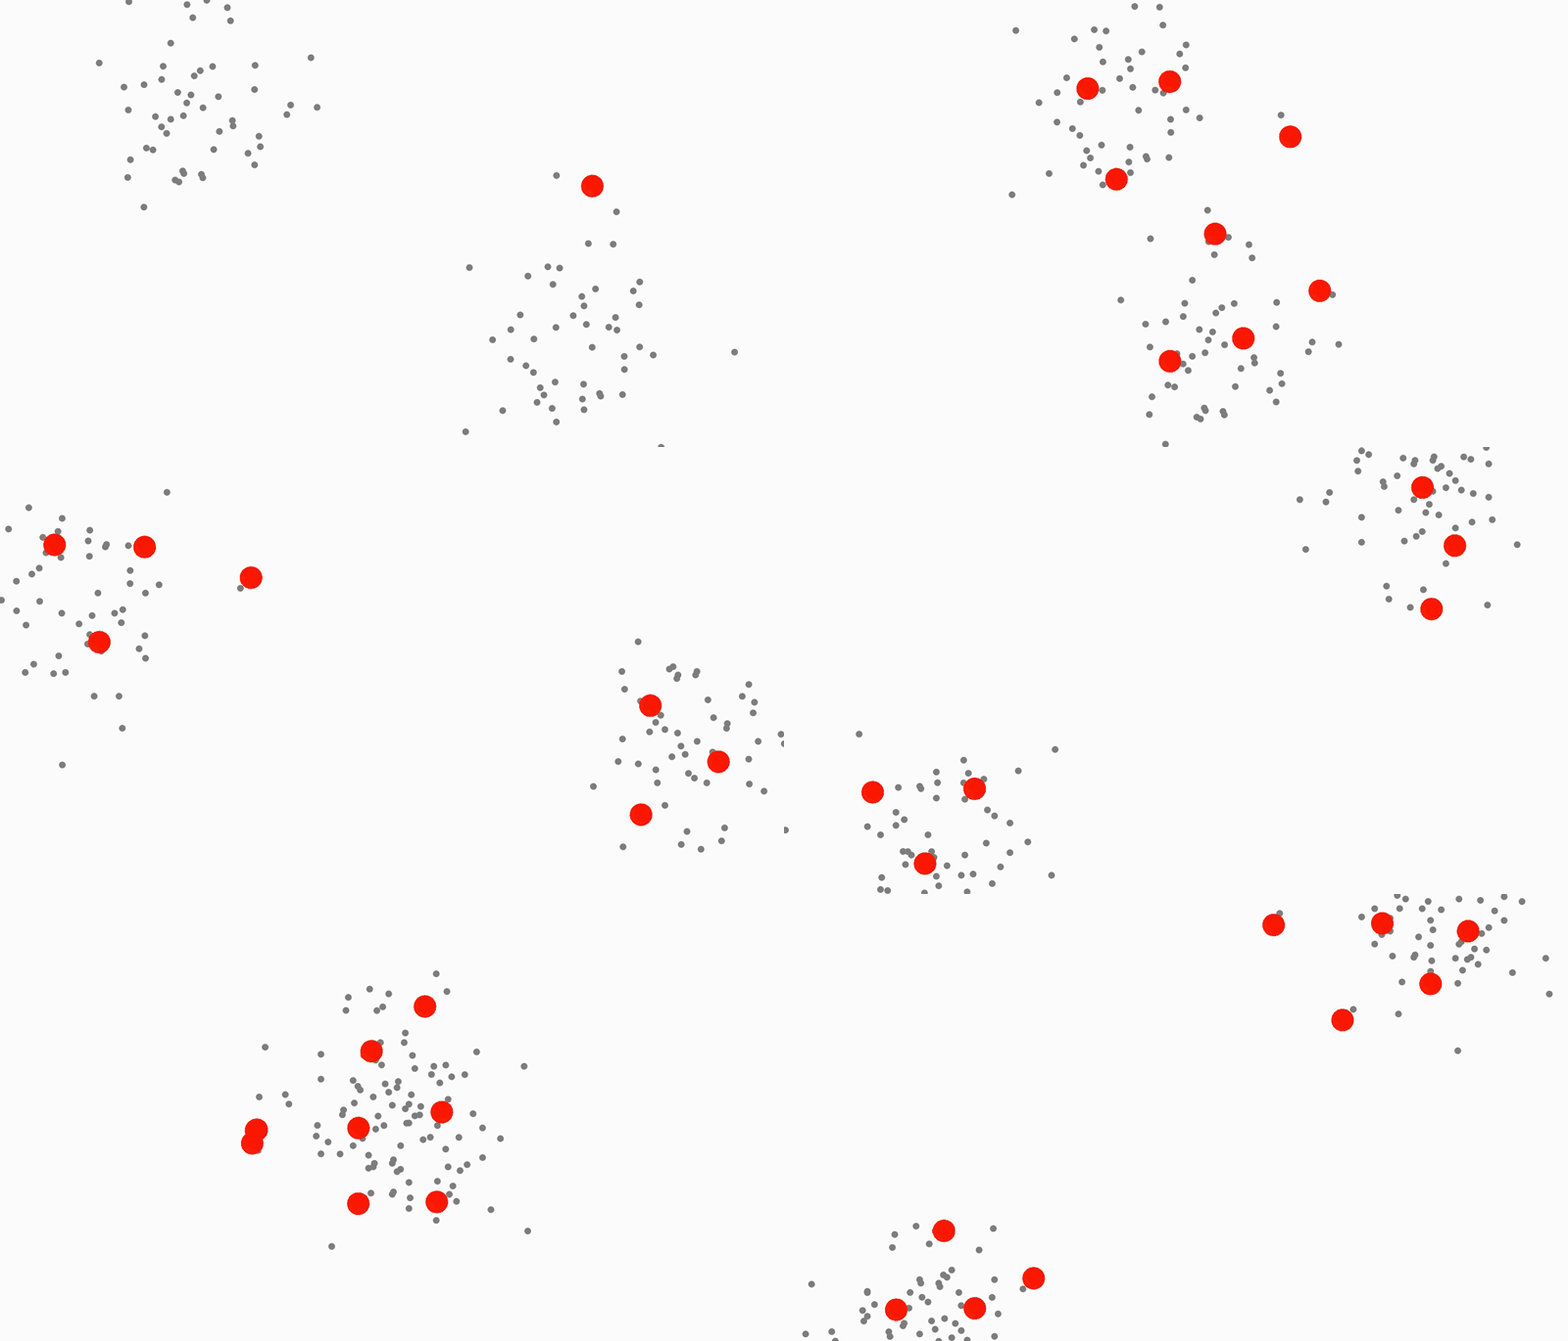
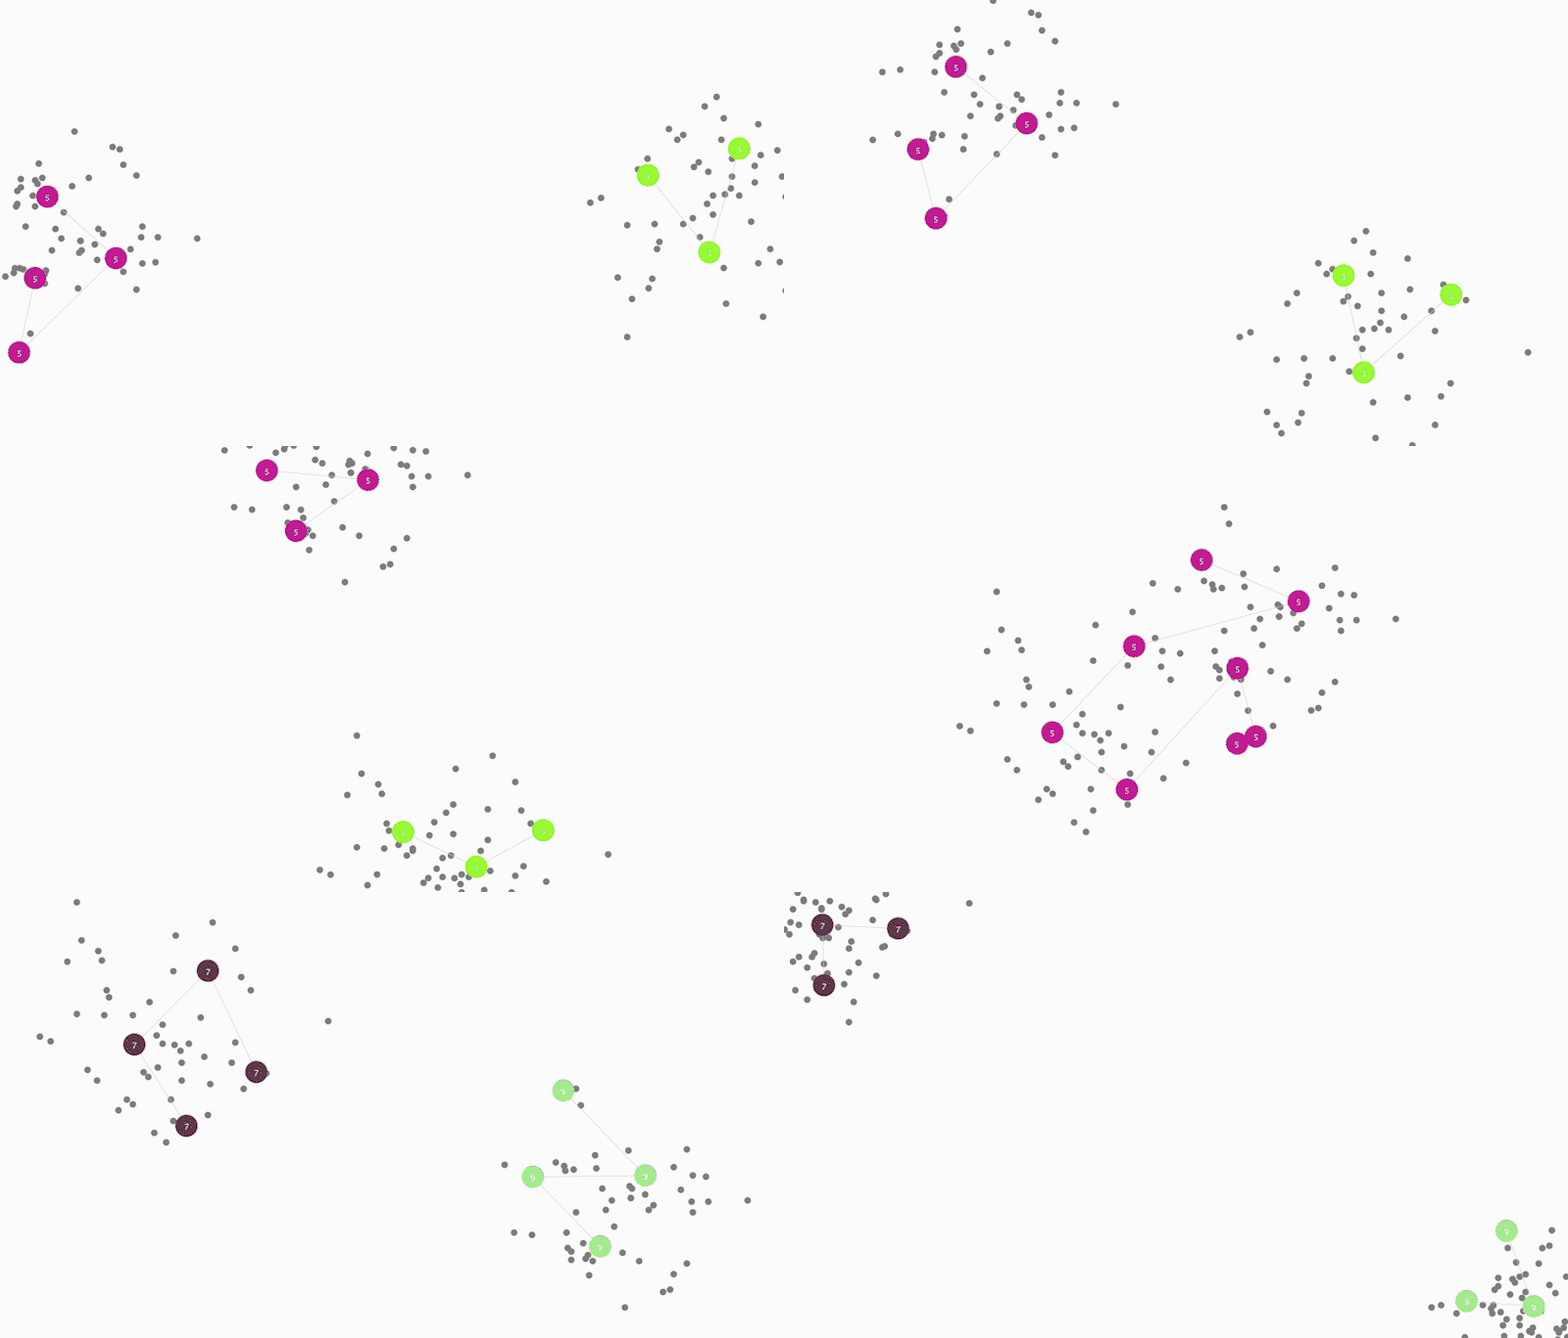
The K-Means clustering algorithm is typically used as a way of finding the centers of clusters in a set of data (such as pixels picked up by a camera/sensor for instance). This makes it perfect for finding bodies and other objects. However, standard K-Means requires that the number of clusters to track be specified ahead of time. This was not acceptable in this situation because at any given time there are an unpredictable number of people within view. Thus, I came up with a growing version of the K-Means algorithm that creates new cluster points and removes old ones based on whether they have covered too many or too little points. The result is clusters that appear to be cells performing mitosis in order to cover all the points without getting too close to one another (this distance is also controllable).
Legend for videos below
• Red/blue circles – Trackers (centers of local clusters aka closest points to them)
• Red circles – Close to the sensor
• Blue circles – Far away from the sensor
• Yellow dots – Closest points (points within local clusters that are closest to the sensor)
• Lines pointing out – Direction of change (direction the trackers are interpolating toward)
Tracking In The Beginning

Tracking of clusters without classification

Tracking of clusters with classification
Single User Interactions
Pointing interaction
Bending forward shows it's tracking by depth (trackers are in 3D)
Arm tracking
Forward facing limbs take priority during tracking (potential switch hands interaction)
Multi-arm tracking
Leg tracking
Putting it all together (stress testing the algorithm)
Multiple User Interactions
Multiple users are tracked and trackers resist leaving their clusters (aka users)
Users may leave and enter at will (the algorithm is always dynamically updating)
Users may pass by each other and retain their trackers (although passing behind requires re-tracking)
Jakob Plotts | Artist • UX Designer • Programmer | 2019